
Core Web Vitals measure three things Google cares about on every page: how fast the main content loads (LCP), how quickly the page responds to input (INP), and how stable the layout stays while loading (CLS). The thresholds for a passing score are LCP under 2.5 seconds, INP under 200 milliseconds, and CLS under 0.1. On a storage facility website, check the unit listing hero image, the booking widget, and any embedded map first: these three elements cause most Core Web Vitals failures on conversion pages.
TL;DR:
- Google evaluates Core Web Vitals based on real user data averaged over a 28-day window, requiring three out of four visits to meet thresholds.
- Field data from the Chrome UX Report and BigQuery provides more accurate insights than single lab tests like Lighthouse, which only simulate visits.
- Fixes for slow loading or unstable pages focus on preload strategies, breaking up long JavaScript tasks, and reserving space for dynamic content.
- Ongoing monitoring should use the CrUX API for regular p75 updates and aggregate data to spot long-term trends and compare pages or templates.
- Prioritize improving booking and unit detail pages first, as their performance has a direct impact on conversions and revenue.
Table of Contents
- What Google's LCP, INP, and CLS scores actually mean
- Tools that measure and diagnose Core Web Vitals
- Setting up real-user monitoring with attribution data
- Fixing LCP, INP, and CLS on booking pages
- Turning field data into an ongoing monitoring routine
- Which storage site pages to fix first
- Choosing a database schema for Core Web Vitals data
- Handling privacy when storing performance data
- Aggregating performance data without losing the signal
- Connecting Core Web Vitals data to your broader monitoring setup
- Why p75 matters more than a single test score
- How Corvane Systems supports storage operators on performance
- Where to go deeper on measurement
- Sources
- FAQ
What Google's LCP, INP, and CLS scores actually mean
Largest Contentful Paint tracks when the biggest visible element, usually a hero photo, headline, or video, finishes rendering. Interaction to Next Paint measures the delay between a user's click, tap, or keypress and the next time the browser paints a response. Cumulative Layout Shift totals up every unexpected movement of visible content, scored as a fraction of the viewport affected multiplied by how far it moved.
Google does not score a single visit. It scores the 75th percentile of all visits to a page or origin over a rolling 28-day window, meaning three out of four real visits need to meet the threshold before Google calls it "good." This point confuses many developers: a fast result in Lighthouse is a lab measurement from one simulated run, while the Chrome UX Report reflects actual Chrome users on real networks and devices, aggregated at p75.
- LCP under 2.5 seconds is considered good, with longer times indicating needs improvement or poor performance.
- INP under 200 milliseconds is considered good, with higher values indicating needs improvement or poor performance.
- CLS below 0.1 is considered good, with higher scores indicating needs improvement or poor performance.
A common mistake is treating a single Lighthouse run as proof a page passes. Lab data is useful for debugging, but only field data, aggregated at p75, determines the score Google actually uses for ranking signals.
Tools that measure and diagnose Core Web Vitals
Different tools answer different questions, and using the wrong one wastes time. For a quick diagnostic on one URL, PageSpeed Insights and Chrome DevTools' Lighthouse panel give you both a lab trace and, when traffic allows, field data for that specific page. The Web Vitals Chrome extension shows live scores as you browse, which helps when testing a booking flow interaction by interaction.
For ongoing measurement across a whole site, the web-vitals library from the Chrome team is the standard. It ships in two builds: a small standard build that reports the three core metrics, and an attribution build that adds diagnostic detail about which element or resource caused the number. Because it uses the same underlying browser APIs Chrome reports to CrUX, its numbers align closely with what Google sees in the field.
- PageSpeed Insights and Lighthouse: fast, single-URL checks combining lab and available field data.
- web-vitals (standard build): lightweight real-user monitoring for production sites.
- web-vitals (attribution build): adds element and timing breakdowns for root-cause work.
- Search Console Core Web Vitals report: aggregates field data across URL groups, showing which pages need attention.
- CrUX API: programmatic access to p75 and histogram data via queryRecord, with a History API for 40 weekly points.
Coverage differs across these sources. CrUX only reports on origins and URLs with enough Chrome traffic, so a low-traffic unit detail page might return no data at all in PageSpeed Insights or the CrUX API, even though Search Console still groups it with similar pages for reporting.
Setting up real-user monitoring with attribution data
Standard web-vitals reporting tells you a page's LCP is 3.8 seconds. It does not tell you why. That's where the attribution build earns its keep: it breaks LCP into timeToFirstByte, resourceLoadDelay, resourceLoadDuration, and elementRenderDelay, and the largest of those four sub-parts is almost always the actionable target, whether that's a slow server response, a resource that was discovered late, or a render that got blocked by CSS.
A practical setup for a storage site's booking pages looks like this:
- Load the standard web-vitals build across the entire site for baseline coverage.
- Sample a smaller percentage of sessions with the attribution build to capture diagnostic detail without inflating every page load.
- Increase that sample rate automatically on connections flagged as slow by the Network Information API, since the long tail hides the worst cases.
- Send results with
navigator.sendBeacon, batching several metrics per beacon rather than firing one request per metric. - Ingest into a store indexed for p75 queries: Postgres works at moderate scale, ClickHouse or BigQuery scale better once volume grows.
Pro Tip: Keep the attribution build on a rolling 10 to 20 percent sample of sessions. Full attribution on every visit adds payload size and ingestion cost without changing which fixes you prioritize.
Fixing LCP, INP, and CLS on booking pages
Once you know which metric is failing and, ideally, which element or script is responsible, the fixes are fairly mechanical.
For LCP, the hero image or headline on a unit listing page is almost always the culprit. Preload that resource with a <link rel="preload"> tag, serve responsive images sized for the viewport instead of one oversized file, and make sure critical CSS loads before anything render-blocking. Reducing time to first byte through a CDN or faster origin server also shrinks the resourceLoadDelay phase that attribution data will flag.
For INP, the usual offenders are long JavaScript tasks that block the main thread when a visitor clicks "Check Availability" or expands a unit size filter. Break long tasks into smaller chunks using scheduler.yield or setTimeout, defer any script that isn't needed for the first interaction, and audit event handlers for work that could run after the paint instead of before it. The Long Animation Frame data surfaced through attribution builds is useful here for pointing at the specific script holding up the thread.
For CLS, layout shifts on storage sites usually come from three sources: embedded maps that load after the surrounding text, third-party booking widgets that inject content late, and ads or promo banners without reserved space. Set explicit width and height attributes on every image and iframe, reserve a fixed height container for any widget before it loads, and avoid animations that change layout properties like top or height instead of transform.
- Preload the hero resource and use responsive images sized to the viewport.
- Break up long JavaScript tasks and defer scripts unrelated to the first interaction.
- Reserve explicit space for maps, widgets, and ads before they load.
Pro Tip: After shipping a fix, don't just rerun Lighthouse once. Watch the p75 field number over a full 28-day window and confirm the delta shows up in real-user data, since a lab improvement doesn't always translate to a field improvement of the same size.
Turning field data into an ongoing monitoring routine
Day-to-day monitoring and deep historical analysis call for different tools. The CrUX API is built for automation: query it daily or weekly and you get the current p75 and histogram for a URL or origin, refreshed on that same 28-day rolling basis. For longer-term trend work, competitor benchmarking, or joining performance data against business metrics, BigQuery's CrUX dataset is the more capable source, since it holds monthly full-histogram data that the API alone doesn't expose.
Search Console's bulk data export creates structured tables you can ingest straight into BigQuery, giving you a single warehouse for both search performance and Core Web Vitals history.
- Pull daily p75 snapshots from the CrUX API for automated dashboards and alerts.
- Ingest Search Console bulk exports into BigQuery for anything needing longer retention.
- Partition BigQuery tables by day and cluster by metric name and route to keep query costs down.
- Compute p75 with
APPROX_QUANTILES(value, 100)[OFFSET(75)]rather than scanning raw rows for percentiles on demand.
BigQuery's CrUX dataset stores monthly full-histogram data, which is the level of detail needed for longitudinal and competitive analysis that the API's rolling window alone can't reconstruct.
Which storage site pages to fix first
Not every page deserves equal attention. Unit detail pages and booking flows convert visitors into leases, so a slow hero image or a laggy availability checker there costs revenue directly. Service-area landing pages come second: they're often the first page a searcher or an AI assistant lands on when comparing nearby facilities.
Performance also feeds into how AI systems evaluate a site. Slow, unstable pages are harder for generative engines to parse cleanly and less likely to get cited as a recommended option.
- Fix unit detail and booking pages first: they carry the direct revenue impact.
- Fix city and service-area landing pages next: they carry most of the discovery traffic.
- Recheck GEO and AI-visibility structured data alongside performance work, since both affect how a facility surfaces in AI-generated answers.
Technical audits, RUM setup, and BigQuery-based monitoring dashboards can help storage operators working through this kind of prioritization.
Choosing a database schema for Core Web Vitals data
Core Web Vitals data is fundamentally time-series data: a metric name, a value, a timestamp, and a page or route. That shape favors a time-series-friendly design even when the underlying database is relational.
A workable schema has one events table with columns for event_time, metric_name (LCP, INP, or CLS), value, page_path, connection_type, and a session identifier for deduplication. Store raw values in that table but never query it directly for dashboards: raw event tables grow fast and full scans get expensive.
Relational databases like Postgres handle this fine at moderate volume, especially with a time-based index and monthly table partitioning. Purpose-built time-series databases or a warehouse like BigQuery pay off once volume grows past what a single Postgres instance handles comfortably, because they're built to compress and aggregate time-ordered data efficiently. The practical dividing line is usually query pattern: if you mostly need "give me p75 for this route over the last 28 days," a warehouse with built-in percentile functions and partition pruning will outperform a relational database doing the same math row by row.
Whichever you choose, partitioning by day and clustering by metric name and route keeps both storage costs and query costs manageable as event volume grows.

Handling privacy when storing performance data
Real-user monitoring data is less sensitive than personal data, but it still touches details that deserve care: IP addresses, device and connection type, and session identifiers that could be linked back to an individual if combined with other data.
Strip or hash IP addresses before storage, and avoid persisting any identifier that ties a performance event to a named user account. A rotating, non-reversible session ID is enough to deduplicate events and compute p75 without keeping anything that identifies a person. If your storage site operates in markets with data protection rules like the GDPR, treat any beacon that includes device or location detail as personal data and apply the same retention and deletion policies you'd apply to other visitor data.
Set a retention window and stick to it. Raw event data older than a defined period, commonly 90 days, should either be deleted or rolled up into aggregate tables that no longer contain session-level detail. This keeps storage costs predictable and reduces the scope of any privacy review.
Aggregating performance data without losing the signal
Storing every raw beacon indefinitely is neither necessary nor affordable. The fix is a tiered rollup: keep raw events for a short window for debugging, then collapse them into daily or weekly p75 summaries by page and metric for anything you'll query regularly.
A daily rollup table with columns for date, page_path, metric_name, and the computed p75 value answers almost every question a dashboard needs to ask, at a fraction of the storage footprint of raw events. Weekly rollups work well for trend charts spanning months, since the 28-day rolling window already smooths out day-to-day noise.
Group by route pattern rather than exact URL where possible. A storage site with hundreds of unit-detail pages that share the same template will usually show the same performance profile, so aggregating by template or route pattern, not by individual page, cuts both storage volume and query time without losing the insight that matters: does this template pass or fail.
Connecting Core Web Vitals data to your broader monitoring setup
Core Web Vitals numbers matter most when they sit next to the metrics that explain their business impact: conversion rate on the booking form, bounce rate on unit listing pages, and organic traffic by landing page. Pulling p75 rollups into the same dashboard as those metrics turns a performance number into a decision.
A straightforward integration pattern feeds daily p75 rollups from your event store into whatever dashboard tool already tracks traffic and conversions, whether that's a general analytics platform or a BigQuery-backed reporting layer. From there, alerting rules can flag a metric crossing from "good" into "needs improvement" the same way they'd flag a traffic drop, so a regression gets caught before it shows up in the Search Console report weeks later.
Why p75 matters more than a single test score
Chasing a perfect Lighthouse run is satisfying, but it's not what Google scores and it's not what your visitors experience. Field data at p75, checked over the full 28-day window, tells you whether real people on real connections are getting a page that works.
Prioritize the pages tied to bookings first. A fast blog post that nobody converts on matters less than a booking flow that's fast for three out of four visitors.
— Mike
How Corvane Systems supports storage operators on performance
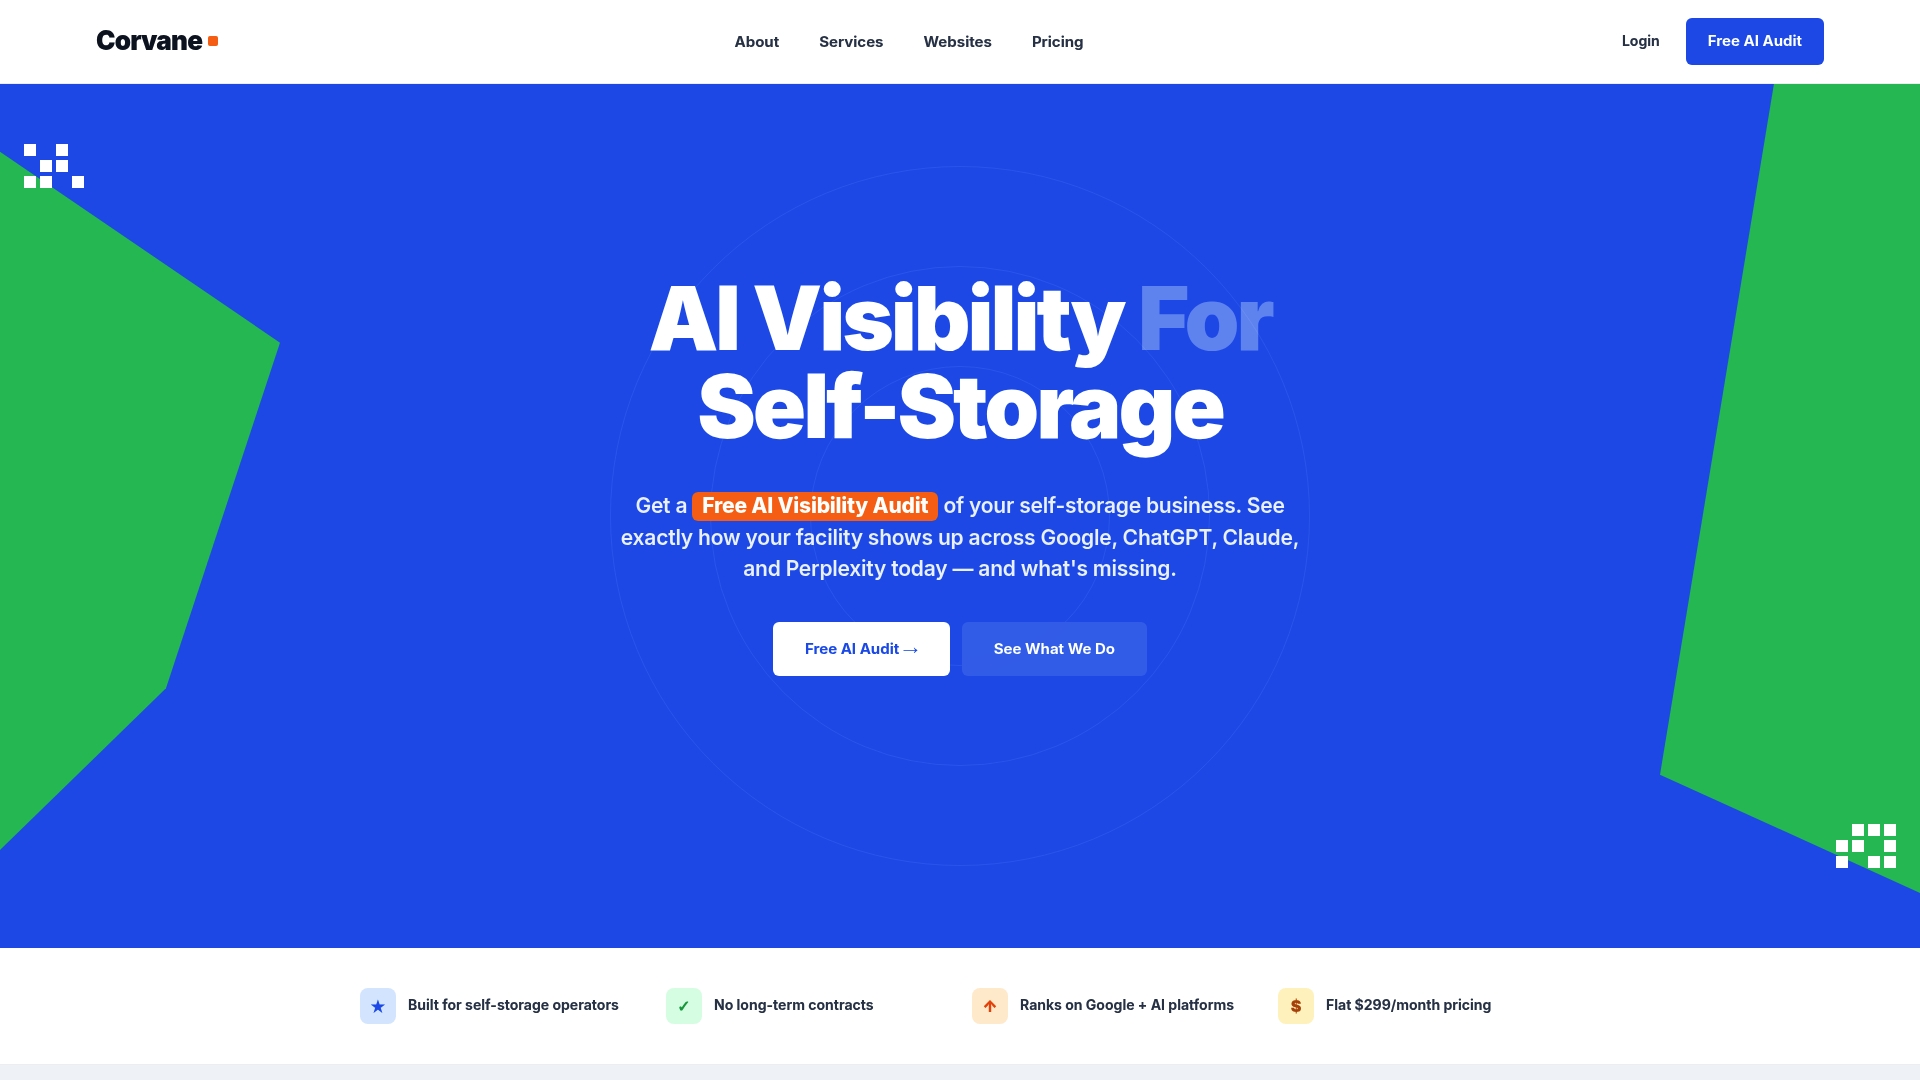
Storage operators don't need to become performance engineers to fix this. Some SEO and AI visibility providers build flat-rate services for self-storage facilities that include the technical side: site audits, RUM setup, and BigQuery-based dashboards that track Core Web Vitals alongside rankings and traffic.
- Technical and on-page SEO audits tuned for storage sites, including performance health checks.
- AI visibility audits scoring how a facility appears across ChatGPT, Claude, Perplexity, and Google's AI Overviews.
- Monthly reporting that ties performance work back to rankings and traffic.
The full Corvane system runs $299 a month with a one-time $50 onboarding fee, no contracts or tiers. Start with a free AI visibility audit to see where your facility's technical and search presence stands today.
Where to go deeper on measurement
For implementation detail beyond this article, consult web.dev's Core Web Vitals docs, the web-vitals library on GitHub, and the CrUX API guide.
Sources
- Core Web Vitals: Core Web Vitals metrics
- GitHub - GoogleChrome/web-vitals: Essential metrics for a ...
- Chrome UX Report (CrUX) guides and API
- Search Console bulk export and BigQuery integration
FAQ
What are the limitations of Core Web Vitals?
Core Web Vitals only measure loading speed, responsiveness, and visual stability, so they miss issues like broken functionality, confusing navigation, or content quality. CrUX field data also only covers origins and pages with enough Chrome traffic, so low-traffic pages can return no data at all.
What is LCP, CLS, and INP?
LCP (Largest Contentful Paint) measures how long the biggest visible element takes to load, CLS (Cumulative Layout Shift) measures unexpected movement of content on the page, and INP (Interaction to Next Paint) measures the delay between a user's action and the page's visual response. Together they form Google's Core Web Vitals, each targeting a different part of the user experience.
What are Google Core Web Vitals?
Google Core Web Vitals are a set of user-centric performance metrics, currently LCP, INP, and CLS, that Google uses to evaluate loading speed, interactivity, and visual stability. They're measured from real Chrome users at the 75th percentile over a rolling 28-day window, not from a single test run.
What is considered a good Core Web Vitals score?
A good score means a page's p75 field data falls under these thresholds: LCP under 2.5 seconds, INP under 200 milliseconds, and CLS under 0.1. A page needs to meet all three thresholds at once to be classified as passing overall.