
Storage market saturation is when rentable self-storage supply in your trade area exceeds demand, driving lower occupancy and downward rent pressure. If you're trying to decide whether to build, buy, reprice, or market harder, the first two things to check are your current occupancy trend over the past four quarters and the volume of new units in your pipeline.
When a market tips into oversupply, three things happen fast:
- Occupancy drops below underwriting targets, often below 85% at stabilized facilities.
- Street rates compress as operators discount to compete for a shrinking pool of active renters.
- Lease-up timelines stretch for new projects, sometimes by 12–18 months beyond pro forma assumptions.
Key Takeaways
Self-storage market saturation is measurable with six core metrics, and operators who track occupancy trends and pipeline data quarterly can act before oversupply erodes their NOI.
| Point | Details |
|---|---|
| Define saturation clearly | Supply exceeding demand drives occupancy below 85% and compresses street rates. |
| Six metrics to track | Occupancy, vacancy, NRSF per capita, absorption, pipeline ratio, and rent growth tell the full story. |
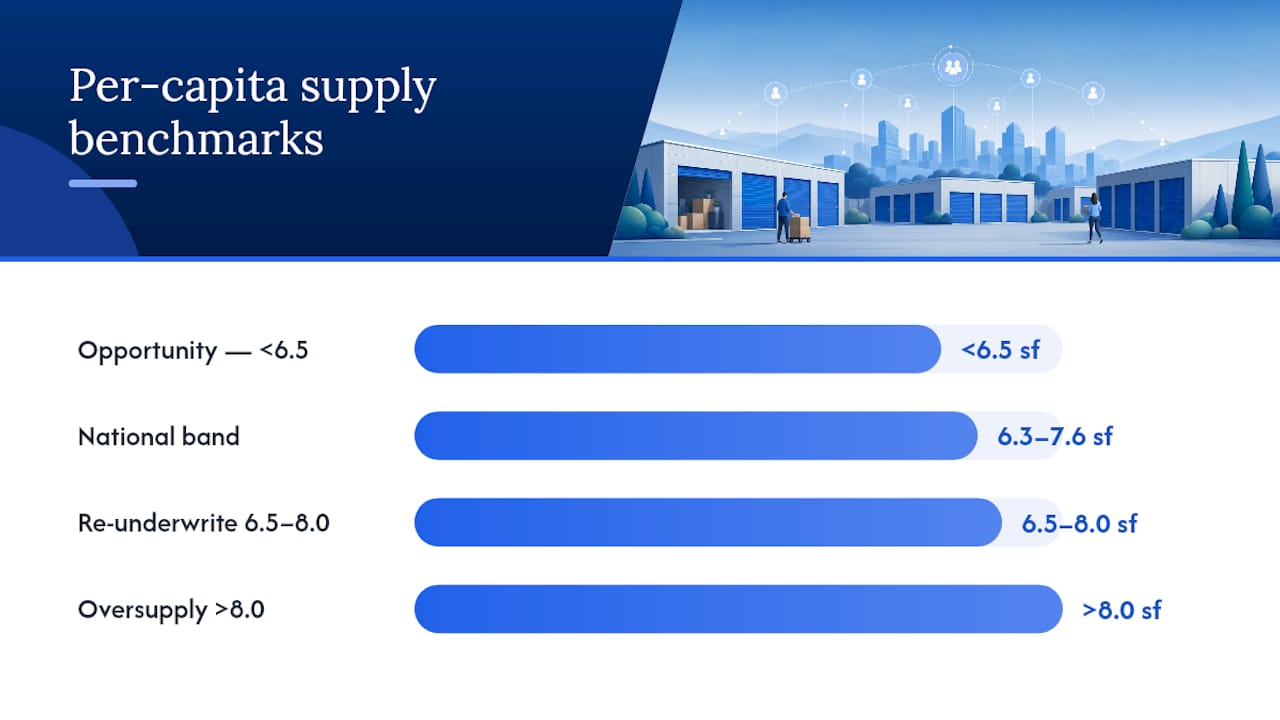
| Per-capita benchmarks vary | Vendor universe changes readings; below ~6.5 sq ft suggests opportunity, above ~8.0 warrants caution. |
| Run the audit quarterly | A 30–90 minute trade-area check using Census data, permit records, and Yardi Matrix or CoStar catches pipeline risk early. |
| Corvanesystems reduces vacancy risk | AI-optimized content and local SEO help your facility capture demand even in crowded markets. |
Table of Contents
- What does storage market saturation look like in practice?
- What metrics actually measure saturation?
- Where do you get the data?
- How to run a 30–90 minute local saturation check
- How to interpret your results
- Worked example: a small-town trade-area check
- What to do if your market is saturated
- How search and AI visibility lower your vacancy risk
- The metric most operators check last
- Corvanesystems helps you compete when your market gets crowded
- Sources
What does storage market saturation look like in practice?
The symptoms are easy to spot once you know what you're watching. Persistent occupancy below your underwriting target is the clearest signal. Add frequent promotional discounting, slowing or negative rent growth, and a cluster of new facilities opening within your primary trade area, and you have a saturated market.
The root causes tend to cluster around a few patterns:
- Speculative development cycles where capital chases recent strong returns, producing a wave of new supply that arrives simultaneously.
- Unit-mix mismatch: a market can be oversupplied in 10x10 climate-controlled units while 5x5 or large drive-up units remain undersupplied.
- Local economic shifts, such as a major employer leaving, that shrink the renter pool faster than supply can be absorbed.
- Clustering dynamics where multiple developers target the same high-visibility corridor.
Industry experts have flagged this cycle directly. Rapid development has increased overbuilding risk in clustered submarkets, with some top MSAs already showing occupancy and rent strain from competing new projects.
The timing gap matters more than most operators realize. A permit pulled today typically means a competing facility opens 18–36 months from now. By the time that supply hits the market, your own lease-up may be stalling. Watch permit activity and pre-leasing commitments in your county's planning department records now, not after the ribbon-cutting.
Pro Tip: Set a Google Alert for your county's planning commission meeting agendas. New self-storage applications often appear months before they show up in any paid database.
What metrics actually measure saturation?
Six numbers tell most of the story. Here are the formulas and what each one means:
| Metric | Formula | Required Inputs | Interpretation |
|---|---|---|---|
| Achieved occupancy | Occupied units / total units × 100 | Facility rent roll | Lower than eighty-five percent occupancy is cautionary; much lower is severe for new projects |
| Vacancy rate | 1 − (occupied units / total units) | Same as above | Rising vacancy over months signals absorption issues |
| NRSF per capita | Total rentable SF in trade area / trade-area population | Competitor inventory, Census population | Lower than about six and a half square feet may indicate opportunity; higher than about eight square feet may suggest oversupply |
| Absorption rate | Net new leased SF over period / total available SF | Rent rolls, period-over-period occupancy | Negative over consecutive quarters means demand may not keep pace with supply |
| Pipeline-to-inventory ratio | Planned + under-construction SF / existing inventory SF | Permit records, paid data | Above ten percent indicates meaningful supply pressure incoming |
| Rent growth / effective rent | (Current street rate − prior period rate) / prior period rate | Rate history | Flat or negative growth while costs rise indicates pricing pressure |
A quick example for NRSF per capita: a trade area with 500,000 rentable square feet and a population of 75,000 yields around six and a half square feet per capita, sitting just above the opportunity threshold. Adding pipeline space increases this ratio and warrants a closer look at absorption.
Square feet per capita is a useful signal but must be weighed with occupancy, unit mix, and local demand drivers. A market that looks fine on a per-capita basis can still have a severe 10x10 glut if the unit mix skews heavily toward that size.
Pro Tip: Use 12-month rolling averages for occupancy and absorption rather than a single month's snapshot. Seasonal swings in college towns or resort markets can make a healthy market look distressed in January.
Where do you get the data?
Free sources:
- U.S. Census Bureau (census.gov): population by ZIP code, county, and metro area. Use the American Community Survey 5-year estimates for trade-area sizing.
- County/city building permit records and planning departments: the most reliable source for pipeline projects in entitlement and pre-construction. Paid databases often miss these until a permit is pulled.
- Google Business Profile and Google Maps: use these to build a competitor list and verify that paid-data facility counts match what's actually open.
Paid industry sources:
- Yardi Matrix: facility-level data, rent tracking, and pipeline reporting. Strong on national coverage and rent trends.
- CoStar: broad commercial real estate coverage with self-storage as a tracked asset class. Useful for rent comps and transaction data.
- Marcus & Millichap research: transaction-focused market reports and cap rate data; useful for acquisition underwriting.
- SpareFoot: marketplace data on advertised rates and availability, useful for street-rate benchmarking.
The vendor-universe effect is real and often underappreciated. Per-capita saturation benchmarks vary widely across data vendors, with published references ranging from roughly 6.07 to 9.5 NRSF per capita depending on which facility universe each vendor counts. A market that looks saturated in one dataset can look healthy in another. Always note the vendor and data vintage when you report any per-capita figure.
Pro Tip: Before you underwrite any deal using paid data, spend 90 minutes doing a drive-by or mystery-shop audit of the top 5–8 competitors in your trade area. Verify that they're open, check their posted rates, and confirm their unit mix. Paid databases go stale.

How to run a 30–90 minute local saturation check
This is a reproducible process. Run it before any development decision, acquisition offer, or major pricing change.
- Define your trade area. Use a 3-mile radius in dense urban markets; a 5-mile radius or drive-time polygon in suburban and rural areas. In markets with natural barriers (highways, rivers), use drive-time. Location factors like traffic patterns and barriers matter more than raw distance.
- Pull population data. Use Census Bureau ACS 5-year estimates for your defined geography.
- Build a competitor inventory. List every facility in the trade area using Google Maps, then cross-check against Yardi Matrix or CoStar. Record name, address, estimated NRSF, and unit mix.
- Compute NRSF per capita. Divide total trade-area rentable SF by population.
- Check current occupancy. If you own a facility in the market, use your own rent roll. For competitors, use Yardi Matrix or mystery-shop calls.
- Pull the pipeline. Check county permit records for any self-storage applications filed in the past 24 months. Add planned and under-construction SF to compute your pipeline-to-inventory ratio.
- Compute 12-month absorption. Compare net leased SF this quarter to the same quarter last year across the trade area.
- Run a sensitivity check. See the mini-table in the worked example below.
A proper market study screens population, competition quality, achievable rents, future pipeline, and yield on cost. If yield under conservative rents isn't compelling, the answer is to walk away.
Market snapshot template:
Pro Tip: In dense urban markets, use a 10–15 minute drive-time polygon rather than a fixed radius. A 3-mile circle in a grid city behaves very differently from a 3-mile circle cut by a freeway.
How to interpret your results
Use these ranges as rules of thumb, not hard cutoffs. Local demand drivers (a university, military base, or tourism economy) can support higher per-capita supply than a comparable bedroom suburb.
| Metric Range | Suggested Action |
|---|---|
| NRSF/capita below 6.5, occupancy above 85% | Pursue: strong demand signal, limited supply pressure |
| NRSF/capita 6.5–8.0, occupancy 85–88% | Re-underwrite: run sensitivity analysis, check pipeline closely |
| NRSF/capita above 8.0, occupancy below 85% | Defer or exit: oversupply risk is elevated |
| Pipeline-to-inventory above 15%, absorption flat | Defer development; consider acquisition only at distressed pricing |
| Occupancy below 85% at existing facility | Severe: pricing and marketing response needed immediately |
National guidance bands of roughly 6.3–7.6 sq ft per person can serve as a starting frame, with markets below about 6.5 often representing opportunity and above roughly 8.0 suggesting potential oversupply. Use them as a starting frame, never as a final answer.
Pro Tip: Always normalize for unit mix and facility class before applying per-capita thresholds. A market dominated by older, non-climate-controlled facilities may show artificially high vacancy in those units while demand for climate-controlled space goes unmet.
Worked example: a small-town trade-area check
Inputs: Hypothetical town, 5-mile trade area.
- Population: 42,000
- Existing rentable SF: 294,000
- NRSF per capita: 294,000 / 42,000 = 7.0 sq ft per capita
- Current blended occupancy: 83%
- Pipeline: 35,000 sq ft permitted, 0 under construction
- Pipeline-to-inventory ratio: 35,000 / 294,000 = 11.9%
- 12-month net absorption: +8,400 SF (about 2.9% of inventory)
- Achievable street rate (10x10 climate): $115/month
Sensitivity table:
What to do if your market is saturated
Short-term pricing moves matter, but they need to be deliberate. Blanket discounting trains renters to wait for deals and compresses your realized revenue faster than occupancy recovers. Instead:
- Offer targeted move-in specials (first month free or 50% off) on your slowest-moving unit sizes only, not sitewide.
- Hold street rates on your best-performing unit types and discount only where vacancy is acute.
- Review your unit mix. If 10x10 climate units are sitting empty while drive-up 10x20s have a waitlist, a conversion may pencil out. Revenue strategies like adding RV/boat storage or wine storage can open demand segments your competitors aren't serving.
- Tighten your pricing strategy with a structured rate-management approach. How facilities set prices in competitive markets is a discipline, not a reaction.
On the marketing side, filling empty units in a saturated market comes down to being more visible and more trusted than the facility down the street. That means a fully optimized Google Business Profile, consistent NAP data across directories, and digital tools that capture demand at the moment someone searches. Track marketing ROI closely in saturated markets; spend that doesn't convert to signed leases within 60 days needs to be reallocated.
No marketing budget fixes a structurally oversupplied market.
Pro Tip: Set a 90-day KPI: track cost-per-lead and cost-per-signed-lease from each channel. In a saturated market, the operator who converts leads fastest wins, not the one who spends the most.
How search and AI visibility lower your vacancy risk
In a saturated market, the operator who gets found first captures the renter. Most of the competitive edge in a crowded trade area now lives in search and AI-assisted discovery, not just pricing.
Corvanesystems is built specifically for this problem. The services most relevant to saturation risk:
- Local search optimization: "storage near me" targeting, Google Business Profile management, and city-level keyword coverage so your facility appears at the top when demand exists.
- AI-optimized content: 30 keyword-focused articles per month, structured so ChatGPT, Claude, Perplexity, and Google's AI Overviews recommend your facility by name.
- AI visibility audits: a scored assessment of how your facility currently appears across AI platforms, with a roadmap to close gaps.
- Performance tracking: monthly reporting on keyword rankings, organic traffic, and search visibility so you know what's working.
Operators using Corvanesystems's approach typically see more qualified inbound leads and stronger local search positioning relative to nearby competitors.
The metric most operators check last
Most operators run a saturation check when they're already in trouble.
The operators who navigate oversupply best aren't necessarily the ones with the lowest prices or the newest facilities. They're the ones who spotted the signal early, adjusted their unit mix before the new supply hit, and made sure their facility was the most visible option in the market when demand thinned out. Visibility in a saturated market isn't a luxury. It's the margin between a facility that stabilizes and one that doesn't.
Corvanesystems helps you compete when your market gets crowded
When your quick saturation check shows elevated risk, the fastest lever you can pull is visibility. Corvanesystems gives self-storage operators a flat-rate SEO and AI search service that puts your facility in front of renters at the exact moment they're searching, whether that's on Google or inside an AI assistant.
No contracts, no tiers, no minimums. You get local search positioning, AI-optimized content, Google Business Profile management, AI visibility audits, and monthly performance reporting, all in one predictable monthly rate. For operators in crowded markets, that means more qualified leads without the guesswork of managing multiple agencies or ad platforms.
Request an AI visibility audit and see exactly where your facility stands across Google, ChatGPT, Claude, and Perplexity before your next competitor opens down the street.
Sources
- Overbuilt to Overwrought: Self-Storage Experts Discuss Industry Growth
- Self Storage Market Study: How to Analyze a Market Before You Build (2026) | OppMap
- The Complete Self-Storage Underwriting Guide | TractIQ
This article is general information, not a substitute for advice from a qualified financial advisor. Consult a qualified financial professional about your own circumstances before acting on anything here.