
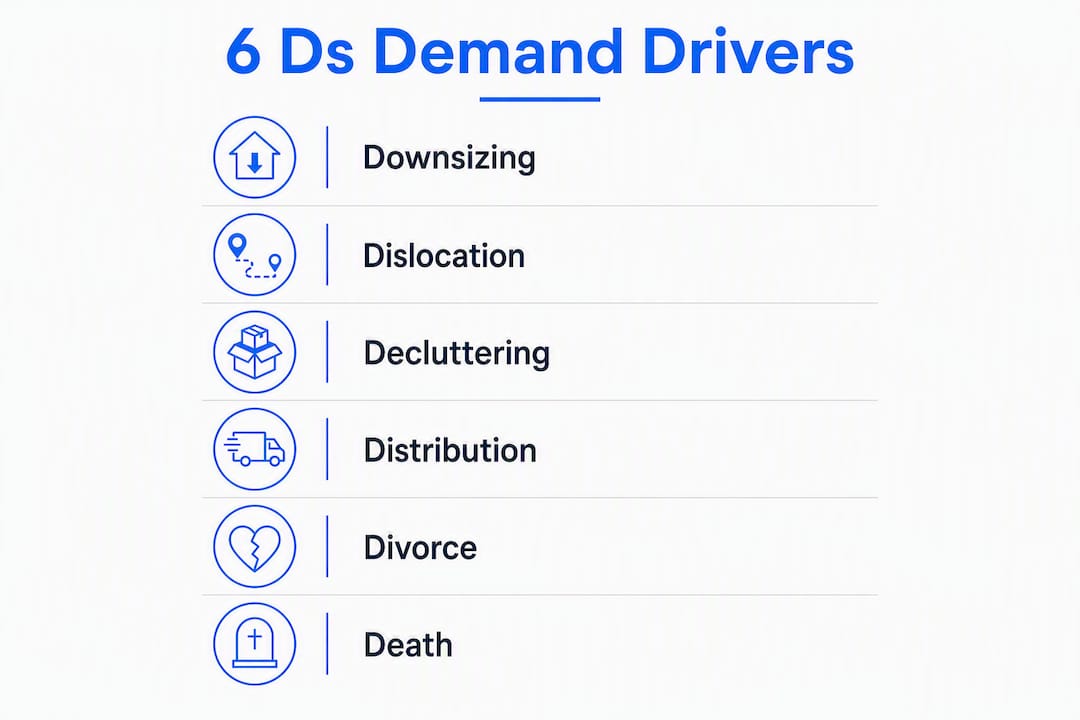
The modern self-storage industry runs on six demand drivers: Downsizing, Dislocation, Decluttering, Distribution, Divorce, and Death. These "6 Ds" explain the vast majority of why people and businesses rent storage units at any given time. But the framework has evolved. The original four-driver model missed two forces that now account for a growing share of new tenants: the e-commerce distribution wave and the lifestyle-driven decluttering trend that has turned storage from a crisis response into a recurring household habit.
CBRE's analysis puts U.S. household penetration at roughly 10.2%, up from 9.3% in 2019, with average space per household rising to about 13.4 square feet. That shift is not random. It reflects structural changes in how Americans live, work, and buy goods online.
TL;DR — Top 3 drivers by current impact:
- Dislocation and Downsizing remain the highest-volume life-event drivers, producing consistent demand across all markets and seasons.
- Distribution (business/e-commerce use) is the fastest-growing segment, reshaping unit-size preferences and access requirements at facilities nationwide.
- Decluttering has converted storage from a one-time event into a persistent, longer-term tenancy pattern, raising average length of stay and stabilizing occupancy.
Operators who align unit mix, pricing, and marketing to these three forces first will capture the most durable demand in their markets.
Table of Contents
- What are the 6 Ds of self-storage demand?
- How macro forces shape storage demand
- How businesses and e-commerce have changed storage demand
- What the data actually shows about storage demand trends
- Which U.S. regions and seasons see the most storage demand?
- How do operators actually measure storage demand?
- What demand drivers mean for investors and operators
- Key Takeaways
- The demand picture operators keep getting wrong
- Corvanesystems helps operators capture demand where it starts
- Useful sources
What are the 6 Ds of self-storage demand?
The 6 Ds framework, popularized by StorageCafe's metro-level demand research, gives operators and investors a structured way to categorize why tenants show up. Each driver has a distinct causal mechanism, a typical tenant profile, and a different implication for unit mix and marketing.
Downsizing
Downsizing happens when a household moves to a smaller home and cannot fit everything into the new space. Retirees moving from a four-bedroom house to a two-bedroom condo are the classic example, but the same pattern applies to young adults leaving a family home for a first apartment. The items stay; the space to hold them disappears. This driver tends to produce longer tenancies because the trigger is a permanent housing change, not a temporary transition.
Dislocation
Dislocation covers any move: job relocation, college enrollment, military deployment, or a cross-country migration. It is the highest-frequency driver because Americans move roughly 27 million times per year. College towns see concentrated dislocation demand every August and May. Military communities near bases like Fort Liberty (North Carolina) or Joint Base Lewis-McChord (Washington) generate year-round churn. Net migration to Sun Belt metros amplifies this further, since households often need interim storage while waiting for a new home to close.

Decluttering
This is the driver that changed the industry's baseline. Decluttering converts a lifestyle preference into a recurring storage relationship. A household that rents a 5×5 unit to hold seasonal gear, holiday decorations, or a collection they cannot part with is not responding to a life crisis. They are managing space as a habit. Research on storage usage trends shows this segment has grown steadily since 2020, and it tends to produce tenants who stay longer and churn less than life-event renters.
Distribution
Small businesses, e-commerce sellers, contractors, and tradespeople now represent a meaningful share of storage demand. A plumber storing pipe fittings, a reseller holding Amazon FBA inventory between shipments, a catering company keeping equipment between events — all of these are distribution use cases. This driver is covered in detail in a later section, but the key point here is that it changes what operators need to offer: longer access hours, drive-up units, and business-friendly lease terms.

Divorce
Divorce splits one household into two, and at least one party typically needs temporary storage during the transition. It is a real demand source at the individual facility level. However, CBRE's long-term analysis finds that divorce shows no statistically significant correlation with industry-wide demand growth, so investors should treat it as episodic rather than structural. It matters for individual market cycles; it does not explain the sector's long-term trajectory.
Death
When a household member dies, the surviving family often needs to clear a home quickly. Estate cleanouts generate short-term, high-volume storage demand. The unit fills fast and may stay occupied for months while the family sorts through belongings. This driver is relatively predictable in markets with aging populations, making it a useful signal for operators in retirement-heavy metros.
Interaction effects matter. Migration into high-cost metros, for example, combines Dislocation with housing affordability pressure, producing tenants who stay longer because they cannot afford to buy. The 6 Ds rarely operate in isolation.
How macro forces shape storage demand
Life events explain individual decisions. Macro forces explain why demand is higher in some markets, at some times, and for some unit types than others.
Housing affordability and home size
Smaller homes mean less built-in storage. As median new-home square footage has fluctuated and urban apartment sizes have compressed, households have fewer closets, garages, and attics to absorb their belongings. This is a structural tailwind for the industry. Markets where housing costs are high relative to income tend to show higher storage penetration because renters in smaller apartments have no alternative.
Migration and employment
Net domestic migration to Sun Belt and Mountain West metros has been one of the most consistent demand multipliers of the past decade. People moving to Phoenix, Austin, or Charlotte often arrive before their new home is ready, need storage during a lease gap, or downsize from a larger home in a higher-cost market. Employment growth drives the same pattern: job creation attracts workers who need temporary housing and, with it, temporary storage.
Military relocations deserve a separate mention. Permanent change of station (PCS) orders move hundreds of thousands of service members every year, and storage is almost always part of the transition. Facilities near military installations can count on a reliable, recurring demand base.
Supply pipeline and unit mix
Demand does not exist in a vacuum. When developers overbuild a market, occupancy falls and asking rents soften even if underlying demand is healthy. The LeClaire Schlosser 2026 investment outlook projects that new deliveries are moderating, which should allow supply and demand to realign in many markets. Operators entering a market with a heavy pipeline face a different environment than those in supply-constrained metros.
Statistic callout: CBRE estimates that roughly 10.2% of U.S. households now use self-storage, up from 9.3% in 2019, with average space per household at 13.4 SF. That 1.3 SF increase per household across millions of homes represents a substantial structural shift in demand.
Budget sensitivity also moderates demand. Markets with lower average rents often sustain higher occupancy because storage behaves like a utility in cost-conscious areas: tenants keep the unit even when money is tight because the alternative (moving belongings or discarding them) costs more.
How businesses and e-commerce have changed storage demand
The distribution driver deserves its own section because it has fundamentally altered the economics of storage facilities that serve it well.
What business storage actually looks like
The tenant profile is broader than most operators expect. It includes:
- E-commerce sellers using units as micro-fulfillment hubs for Amazon FBA, Etsy, or Shopify inventory between restocking cycles.
- Contractors and tradespeople (electricians, plumbers, landscapers) storing tools, materials, and equipment between jobs.
- Small retailers holding seasonal overflow inventory that does not fit in their storefront.
- Caterers, photographers, and event planners storing equipment between engagements.
For a deeper look at how operators can serve this segment, the business inventory storage guide covers unit selection, access requirements, and lease considerations in detail.
How distribution demand differs from household demand
Business tenants tend to stay longer, pay on time, and need larger units with drive-up access. Their seasonality differs from household renters: a retailer's demand peaks before the holiday season, not in the summer moving season. They are also more sensitive to access hours. A facility that closes at 7 PM loses business tenants to one that offers 24-hour access.
Length of stay is the biggest operational difference. A household renter triggered by a move may stay six to twelve months. A small business using a unit as a storage hub may stay for years, producing lower turnover and more predictable revenue.
Pro Tip: Target business tenants with keywords like "business inventory storage" and "contractor storage units" in your Google Business Profile and website content. These searches have lower competition than generic "storage near me" queries and attract longer-staying, higher-value tenants.
Operational implications
Facilities serving distribution demand should audit their unit mix for drive-up availability, review access-hour policies, and consider whether their lease terms accommodate commercial use. Insurance requirements may differ for business tenants, and signage that explicitly welcomes small businesses signals availability to a segment that often searches specifically for commercial-friendly facilities.
What the data actually shows about storage demand trends
Industry research has produced some findings that contradict the conventional wisdom operators often rely on.
Key findings from CBRE, StorageCafe, and LeClaire Schlosser
| Metric | Finding | Source |
|---|---|---|
| Household penetration | ~10.2% of U.S. households use self-storage | CBRE |
| Avg. SF per household | 13.4 SF | CBRE |
| Search interest growth | 88% rise since 2020, record volume in 2024 | StorageCafe |
| Supply outlook | New deliveries moderating; demand tailwinds from aging population and Millennial/Gen Z adoption | LeClaire Schlosser |
| Divorce correlation | No statistically significant link to industry-wide growth | CBRE |
The divorce finding is worth emphasizing. Many operators and investors treat divorce as a reliable structural driver. CBRE's analysis says otherwise: it is episodic, not structural. Facilities in markets with high divorce rates should not underwrite long-term demand projections on that basis.
The 88% rise in search interest since 2020 is a different kind of signal. It reflects growing consumer awareness and online discovery behavior, which means that operators who are not visible in search and AI platforms are missing demand that already exists.
LeClaire Schlosser's outlook adds a demographic layer: Millennials and Gen Z are adopting storage as a lifestyle tool rather than a crisis response. That shift lengthens average tenancy and reduces turnover volatility, which is good for operators but requires a different acquisition and retention approach than the traditional life-event marketing model.
Yardi and Storable, the two dominant analytics platforms in the industry, provide operators with market-level occupancy and rate data that can validate or challenge these national trends at the local level. Both are worth integrating into any serious market analysis workflow.
Which U.S. regions and seasons see the most storage demand?
Geography matters as much as demographics when evaluating storage demand. The same life events produce different storage outcomes depending on where they happen.
Regional patterns
StorageCafe's metro-level analysis finds the West leads U.S. metros in combined demand indicators, with the South close behind. The Northeast and Midwest often show lower per-capita usage. The reason is structural, not cultural.
CBRE's "4 Bs" framework explains the variance: Basements, Babies, Budget, and Bedrooms. Homes in the Northeast and Midwest frequently have basements, which function as built-in storage. Sun Belt homes typically do not. A household in Phoenix with a 2,500-square-foot home and no basement has far less usable storage than a household in Cleveland with the same footprint and a full basement. That single architectural difference drives measurably higher external storage adoption in Sunbelt markets.
| Region | Demand Profile | Key Driver |
|---|---|---|
| West (CA, WA, OR, AZ) | High penetration, premium rents | No basements, high housing costs, migration |
| South (TX, FL, GA, NC) | Fast-growing demand, new supply risk | Net migration, no basements, population growth |
| Northeast (NY, MA, CT) | Lower per-capita usage | Basements common, older housing stock |
| Midwest (IL, OH, MI) | Moderate, stable demand | Basements common, slower population growth |
Climate also shapes unit preferences. Hot, humid Southern markets drive demand for climate-controlled units to protect furniture, electronics, and documents. Operators in those markets who underinvest in climate control leave revenue on the table.
Seasonal and transient demand
Summer is the peak season for household storage, driven by the moving season (May through August). College towns add a sharp, predictable spike: students move out in May and back in August, often needing short-term storage for a few months. Military communities generate year-round demand but spike during PCS season (typically May through September).
Operators who understand their local seasonal pattern can time promotions, adjust street rates, and prepare unit availability accordingly rather than reacting after occupancy has already moved.
How do operators actually measure storage demand?
Knowing the drivers is one thing. Measuring whether they are producing real demand in a specific market requires a different set of tools.
Core metrics to track
- Market-rate occupancy: The percentage of units occupied at full asking rent, not discounted or owner-occupied rates.
- Asking/street-rate trends: Month-over-month changes in advertised rents signal whether the market is tightening or softening.
- Move-in rate and lead-to-lease conversion: How many inquiries convert to signed leases, and how quickly.
- Unit fill-up time: How long it takes a newly opened facility or recently vacated unit to reach stabilized occupancy.
- Square feet per capita: A market-level indicator of whether supply is already saturated relative to population.
- Competitor pipeline: Permitted and under-construction projects that will add supply within 12–18 months.
Investomation's operator diagnostic framework structures these into a practical checklist: sqft/capita, occupancy at market rates, rate elasticity, fill-up speed, unit mix alignment, and future supply. Running through that list in order gives a reliable picture of market health.
Pro Tip: Always analyze occupancy at market-rate price points, not headline occupancy. A facility reporting 95% occupancy may have 20% of those units discounted 40% or occupied by the owner's relatives. Market-rate occupancy is the number that actually tells you whether the market can support your asking rent.
A diagnostic workflow for operators
- Pull sqft-per-capita for the trade area (3–5 mile radius). Above 8–9 SF/capita typically signals a saturated market.
- Check market-rate occupancy across competing facilities, not just your own.
- Review street-rate trends over the past 6–12 months. Flat or declining rates in a high-occupancy market suggest discounting is widespread.
- Measure your own lead-to-lease conversion rate. A drop signals either a pricing problem or a discovery problem.
- Map the competitor pipeline. Any new supply delivering within 18 months will pressure your occupancy before it stabilizes.
- Assess unit mix against the demand profile. If distribution demand is growing locally but you have no drive-up units, you are structurally misaligned.
Common measurement pitfalls
Headline occupancy is the most frequently misread metric. High occupancy can hide deep discounts, owner-occupied units, or tenants who have not paid in months. COVID-era occupancy figures were distorted by eviction moratoriums that kept non-paying tenants in units. Any market analysis that relies on pre-2022 occupancy data without adjusting for those distortions will overstate true demand.
What demand drivers mean for investors and operators
Understanding the drivers is only useful if it changes decisions. Here is how each major driver translates into a concrete operational or investment choice.
Unit mix
- Urban and high-cost markets with strong decluttering demand need more small units (5×5, 5×10). These tenants are not moving furniture; they are storing overflow.
- Distribution-driven markets need drive-up access and larger units (10×20, 10×30). A facility without drive-up access in a contractor-heavy market is leaving a segment unserved.
- Downsizing demand from retirees often requires climate-controlled medium units (10×10, 10×15) for furniture and valuables.
Pricing strategy
Street-rate discipline matters more than promotional fill during periods of rising demand. Filling units at a 30% discount to capture occupancy locks in below-market revenue and trains tenants to expect promotions. Effective rent-change initiatives (ECRI) allow operators to gradually move existing tenants toward market rates, but they work best when the underlying market is tight. In oversupplied markets, promotional fill may be necessary to reach stabilization, but operators should set a clear timeline for transitioning to market rates.
For practical tactics on filling units and growing revenue, the revenue strategy guide covers ECRI timing, promotional structures, and rate management in detail.
Marketing and discovery
Each demand driver has a corresponding search and discovery behavior:
- Dislocation: Target "storage near me" and city-specific keywords. These tenants are searching urgently and locally.
- Distribution: Target "business storage," "contractor storage," and "inventory storage" keywords. Lower competition, higher-value tenants.
- Decluttering: Target "declutter storage," "seasonal storage," and "extra space storage" terms. These tenants are browsing, not in crisis mode.
- Downsizing: Target retirement community adjacency and "moving storage" keywords. Partner with local real estate agents and senior living communities.
Operational checklist for market entry or rising supply
- Audit unit mix against the local demand profile before breaking ground or acquiring.
- Set street rates at market, not below, and use promotions sparingly with defined end dates.
- Optimize Google Business Profile for the demand segments most active in your market.
- Monitor competitor pipeline monthly during the first two years of operation.
- Track lead-to-lease conversion weekly. A drop of more than a few percentage points over 30 days is an early warning signal.
Key Takeaways
The 6 Ds framework, backed by CBRE, StorageCafe, and LeClaire Schlosser data, gives operators and investors the clearest available map of what drives self-storage demand and where to focus resources.
| Point | Details |
|---|---|
| 6 Ds drive most demand | Downsizing, Dislocation, Decluttering, Distribution, Divorce, and Death explain the majority of storage rental decisions in the U.S. |
| Penetration has risen structurally | CBRE estimates 10.2% of U.S. households now use self-storage, up from 9.3% in 2019, with 13.4 SF per household on average. |
| Distribution is the growth segment | Business and e-commerce tenants stay longer, pay reliably, and are underserved by facilities without drive-up access or extended hours. |
| Measure market-rate occupancy | Headline occupancy misleads; Investomation's diagnostic framework prioritizes rate-resilient occupancy and fill-up speed as the reliable signals. |
| Corvanesystems for search visibility | Corvanesystems helps storage operators capture demand from all 6 Ds by improving search and AI visibility for the exact queries each driver produces. |
The demand picture operators keep getting wrong
Most operators treat the 6 Ds as a checklist rather than a hierarchy. They market to everyone and optimize for no one. The evidence points in a different direction.
Dislocation and Downsizing will always be the volume drivers, but they are also the most competitive segments because every facility in a market is chasing the same moving-season tenant. The operators who are pulling ahead right now are the ones who have figured out that Distribution and Decluttering tenants are underserved, less price-sensitive, and far more likely to stay for years rather than months.
The LeClaire Schlosser supply moderation outlook and CBRE's data on rising penetration among younger cohorts both point to the same conclusion: the structural tailwinds are real, but they will not lift every facility equally. A facility with the wrong unit mix, poor online visibility, or no marketing strategy for business tenants will underperform even in a healthy market. The operators who will benefit most from moderating supply are the ones who have already aligned their unit mix and discovery channels to the demand profile of their specific market, not the national average.
Divorce is the driver most worth deprioritizing. CBRE's finding that it shows no statistically significant correlation with industry-wide growth is not a reason to ignore it entirely, but it is a reason not to build a marketing strategy around it. Treat it as a bonus when it shows up, not a pillar.
Corvanesystems helps operators capture demand where it starts
When a potential tenant searches "contractor storage near me" or asks an AI assistant for storage options in their city, the facilities that surface are the ones that have been optimized for exactly those queries. Most storage operators are invisible to the AI platforms that now influence a growing share of booking decisions.
Corvanesystems is built specifically for self-storage operators who want to close that gap. The flat-rate service includes 30 keyword-optimized articles published monthly, local SEO targeting for demand-specific queries (distribution, decluttering, student storage, and more), Google Business Profile management, and AI visibility audits across ChatGPT, Claude, Perplexity, and Google's AI Overviews. No contracts, no tiers, no guessing about what is included. StorageCafe's data shows search interest in self-storage has risen 88% since 2020, with record volume in 2024. That demand is already out there. The question is whether your facility is the one it finds. Schedule a discovery call with Corvanesystems to see exactly where you stand.
Useful sources
The findings in this article draw on a small set of high-quality industry sources. Each is worth bookmarking for ongoing market research.
-
CBRE Investment Management: Self-Storage Investing — Institutional-grade analysis covering penetration rates, the 4 Bs framework, and the counterintuitive finding on divorce. The most authoritative single source for structural demand data.
-
Investomation: How to Analyze Self-Storage Demand — Operator-focused diagnostic guide covering the metrics and workflow for evaluating a market. The most practical source for facility managers and acquisition analysts.